Sign up for CNN’s Wonder Theory science newsletter. Explore the universe with news about fascinating discoveries, scientific advances and more.
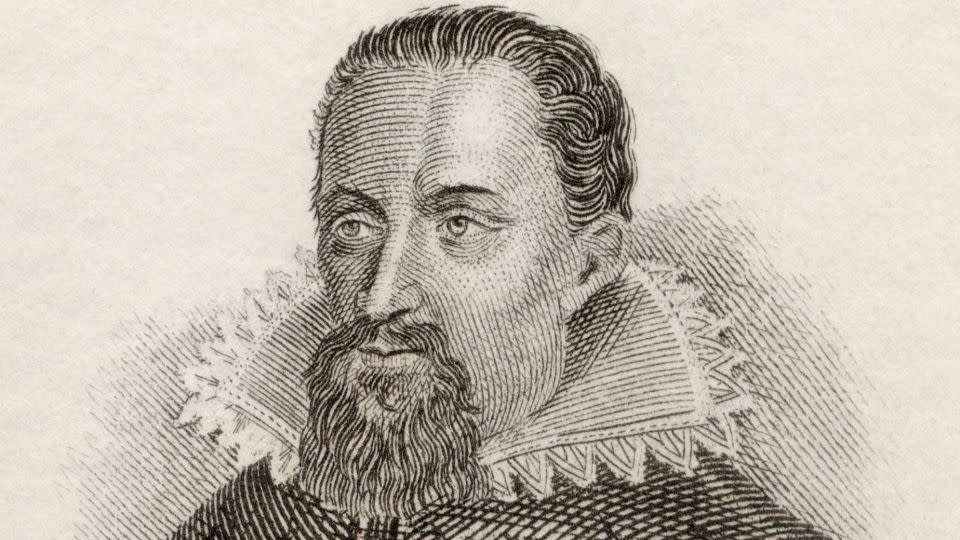
German astronomer Johannes Kepler created drawings of sunspots based on his observations of the Sun’s surface in 1607, and centuries later, these pioneering drawings are helping scientists solve a mystery about the Sun.
Although everything in the solar system revolves around the Sun, scientists have yet to unravel many of the star’s mysteries.
But studying the sun’s variability over time, including the solar cycle, could answer some of the longest-standing questions about the fiery sphere and how it changes.
Some of these questions revolve around solar activity in the 17th century, which was a turning point in the study of the Sun.
Astronomers first observed sunspots with telescopes in 1610. At the same time, the sun was transitioning into an unusually long period of weak activity. And Kepler’s sketches, long ignored because they were drawings rather than telescopic observations, could provide important historical insights.
A new study that recreates the conditions under which Kepler made his drawings was published July 25 in The Astrophysical Journal Letters.
“Kepler left its legacy even in the space age, contributing to many historic milestones in astronomy and physics in the 17th century,” Hisashi Hayakawa, assistant professor at the Space-Earth Environmental Research Institute of Nagoya University and lead author of the study, said in a statement.
“Here we add to this by showing that Kepler’s sunspot records predate existing telescopic sunspot records from 1610 by several years. The sunspot drawings serve as a testament to his scientific acumen and perseverance in the face of technological limitations.”
Turbulent activity of the sun
The Sun experiences an 11-year cycle of increasing and decreasing activity, known as the solar cycle. Scientists believe it has now reached or is nearing solar maximum, the peak of annual activity for the current solar cycle, called Solar Cycle 25.
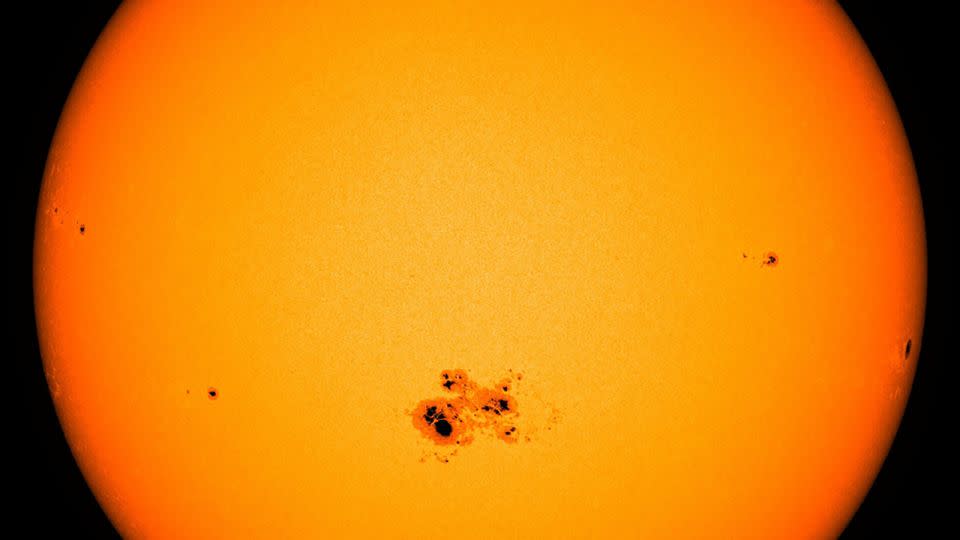
Solar maximum is often associated with an increase in the number of sunspots visible on the sun’s surface. These dark areas, some of which can be the size of Earth or larger, are driven by the sun’s powerful and constantly changing magnetic fields.
Today, scientists monitor solar activity using data from ground- and space-based observatories, magnetic maps of the sun’s surface, and ultraviolet observations of the sun’s outer atmosphere.
But centuries ago, just trying to observe the sun was a difficult task.
Sunspots are observed with the naked eye near sunrise or sunset, when fog, haze, wildfire smoke or the atmosphere helps reduce the sun’s brightness, said Mark Miesch, a research scientist at the National Oceanic and Atmospheric Administration’s Space Weather Prediction Center in Boulder, Colorado. Miesch was not involved in the new research.
Kepler used a device called a camera obscura, which projected an image of the Sun onto a piece of paper by cutting a small hole in the wall of the instrument, and drew the features he observed. Kepler mistakenly thought he had captured Mercury orbiting the Sun in May 1607, but he later retracted his report 11 years later and determined that he had observed a group of sunspots.
“Since this record is not a telescopic observation, it has only been discussed in the context of the history of science and has not been used in quantitative analyses for solar cycles in the 17th century,” Hayakawa said.
“But this is the oldest sunspot drawing ever made with instrumental observation and projection. We realized that this sunspot drawing could tell us the location of the sunspot and the phase of the solar cycle in 1607, as long as we were able to narrow down the observation point and time and reconstruct the inclination of the heliographic coordinates (i.e. the positions of features on the Sun’s surface) at that point in time.”
A great solar minimum
Sunspots aren’t the only way scientists understand changes on the sun. Shifts in the sun’s magnetic field also regulate the movement of high-energy particles called cosmic rays through space, Miesch said.
When cosmic rays enter the Earth’s atmosphere, they can change the Earth’s chemistry, including its carbon balance.
“Over time, this carbon gets incorporated into plants and animals, and even into ourselves,” Miesch said. “Tree rings provide a unique opportunity to track changes in carbon from one year to the next. Some rings in ancient trees can be traced back thousands of years. Isotopes of carbon and other elements can similarly be tracked through air bubbles trapped in glacial ice cores.”
Carbon isotopes trapped in tree rings and ice cores are used to contextualize ancient sunspot observations and expand our understanding of solar activity before the sunspot observations were made, Miesch said.
Such data have been used to help astronomers understand the Maunder Minimum, a period of extremely weak and anomalous solar cycles between 1645 and 1715. During this so-called grand solar minimum, sunspots almost disappeared, and the few observed spots only appeared in the southern solar hemisphere. The background mechanism of the grand solar minimum is still debated by astronomers today, particularly as they attempt to understand when and if it will occur in the centuries to come.
But astronomers agree that solar activity gradually changes from regular cycles to grand minima.
A previous tree ring analysis had suggested that a short solar cycle, Solar Cycle minus 14, lasted only about five years, giving way to an extremely long solar cycle of 16 years, known as Solar Cycle minus 13.
“If it’s true, that would be really interesting,” Hayakawa said. “However, another reconstruction based on tree rings showed a series of solar cycles with normal durations (11 years). So which reconstruction should we trust? It’s extremely important to check these reconstructions with independent – preferably observational – records.”
He then turned to Kepler’s drawings.
Hayakawa and his colleagues translated Kepler’s original report, written in Latin, to understand the exact orientation of the sunspot patterns and to narrow down the time period and locations in which Kepler made the observations.
Hayakawa then visited sites in Prague, including Kepler’s residence in the French Royal Palace and the workshop of palace technician Justus Burgi, to better understand the topography where Kepler saw the sunspots.
Modern data tools allowed Hayakawa and his colleagues to calculate the sunspot’s inclination and determine its location on the sun. They also applied Spörer’s law, first observed by British amateur astronomer Richard Christopher Carrington but later developed by German astronomer Gustav Spörer, which describes the migration of sunspots from higher to lower latitudes during the solar cycle.
The research team found that the sunspot cluster observed by Kepler dates from the end of the minus 14th phase of the Solar Cycle, not the beginning of the minus 13th phase of the Solar Cycle.
The findings support the idea that Solar Cycle minus 13 regularly lasted 11 years, rather than 16. The researchers were also able to estimate that Solar Cycle minus 13 likely began between 1607 and 1610.
“This shows a typical transition from the previous solar cycle to the next cycle, in accordance with Spörer’s law,” study co-author Thomas Teague, an observer at the Solar Effects Data Analysis Centre at the Royal Observatory of Belgium, said in a statement.
Hayakawa said it’s time to find another scientific precursor to the Maunder Minimum, considering that the longest solar cycle recorded in the last three centuries lasted 14 years.
Kepler’s lasting legacy
Sabrina Bechet, a researcher at the Royal Observatory of Belgium and co-author of the study, said there is much to learn from historical figures like Kepler.
“As one of my colleagues put it to me, it’s fascinating to see how the legacy records of historical figures, even centuries later, convey important scientific implications to modern scientists,” Bechet said. “In Kepler’s case, we are standing on the shoulders of a scientific giant.”
Hayakawa said Kepler’s drawings help inform ongoing debates about the solar cycles that led to the Maunder Minimum and may also help astronomers model the conditions before the event.
“By placing Kepler’s findings within broader solar activity reconstructions, scientists gain important context for interpreting changes in solar behavior during this key period that marks the transition from regular solar cycles to grand solar minimum,” he said.
Miesch called the new study “an impressive piece of work” and an example of detective work that offers new insights from the historical record.
“The long history of sunspot observations provides a link to generations of astronomers who have viewed the sun with reverence and curiosity, moving from superstition to scientific study and understanding. It is inspiring to see astronomers of the past continue to contribute to scientific discovery. And their efforts are more important than they could ever imagine as our technological society becomes increasingly vulnerable to the untimely waxing and waning of solar activity.”
For more CNN news and bulletins, create an account at CNN.com