If you look at the history of Atlantic hurricanes since the late 1800s, you can see that hurricane frequency has increased.
While 2020 was the year with the highest number of tropical cyclones in the Atlantic with 31, 2021 witnessed the third highest number of cyclones after 2005. The last decade has seen five of the six most destructive Atlantic hurricanes in modern history.
Then comes a year like 2022, where a major hurricane doesn’t make landfall until Fiona and Ian hit in late September. There were eight hurricanes and 14 named storms during the Atlantic hurricane season, which ended November 30. This is a reminder that small sample sizes can be misleading when assessing trends in hurricane behavior. There is so much natural variability in hurricane behavior from year to year and even decade to decade that we need to look much further back for the true trends to become clear.
Fortunately, hurricanes leave scars that go back thousands of years.
This two-thousand-year-old evidence shows that the Atlantic has experienced much stormier periods in the past than we have seen in recent decades. This is not good news. This tells coastal oceanographers like me that we may be significantly underestimating the threat that future hurricanes will pose to the Caribbean islands and North American coasts.
Natural records left behind by hurricanes
When a hurricane approaches land, its winds can stir up powerful waves and currents, sweeping coarse sand and gravel into marshes, deep coastal ponds, sinkholes, and lagoons.
Under normal conditions, fine sand and organic matter such as leaves and seeds fall into these areas and settle to the bottom. Therefore, when coarse sand and gravel are washed away, a distinct layer is left behind.
Imagine cutting into a layer cake—you can see each layer of frosting. Scientists can see the same effect by plunging a long tube into the bottom of these coastal marshes and ponds and pulling up several feet of sediment in what are known as sediment cores. By examining the layers of sediment, we can see when coarse sand is exposed, which indicates extreme coastal flooding from a hurricane.
With these sediment cores we were able to document evidence of Atlantic hurricane activity over thousands of years.

We now have dozens of chronologies of hurricane activity in different locations, including New England, the Florida Gulf Coast, the Florida Keys, and Belize, revealing patterns in hurricane frequency on scales ranging from decades to centuries.
Others, including those from Atlantic Canada, North Carolina, northwestern Florida, Mississippi and Puerto Rico, are lower resolution, meaning it is nearly impossible to distinguish individual hurricane layers accumulated decades apart. However, they can be quite informative for determining the timing of the most intense hurricanes, which can have significant impacts on coastal ecosystems.
However, it is the records from the Bahamas at nearly annual resolution that are vital to seeing the long-term picture of the Atlantic Basin.
Why are the Bahamas so important?
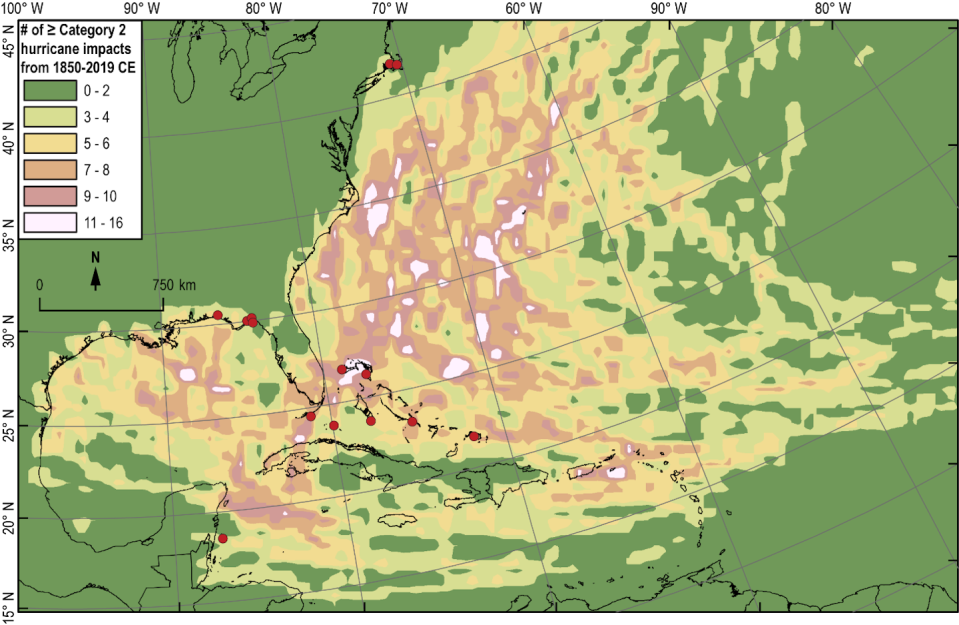
The Bahamas is extremely vulnerable to the effects of major hurricanes due to its geographical location.
In the North Atlantic, 85% of all major hurricanes form in the region known as the Main Development Region off the coast of West Africa. Looking at hurricane tracks over the last 170 years alone, my analysis shows that approximately 86% of major hurricanes affecting the Bahamas also form in this region, suggesting that the frequency variability in the Bahamas may be representative of the basin.
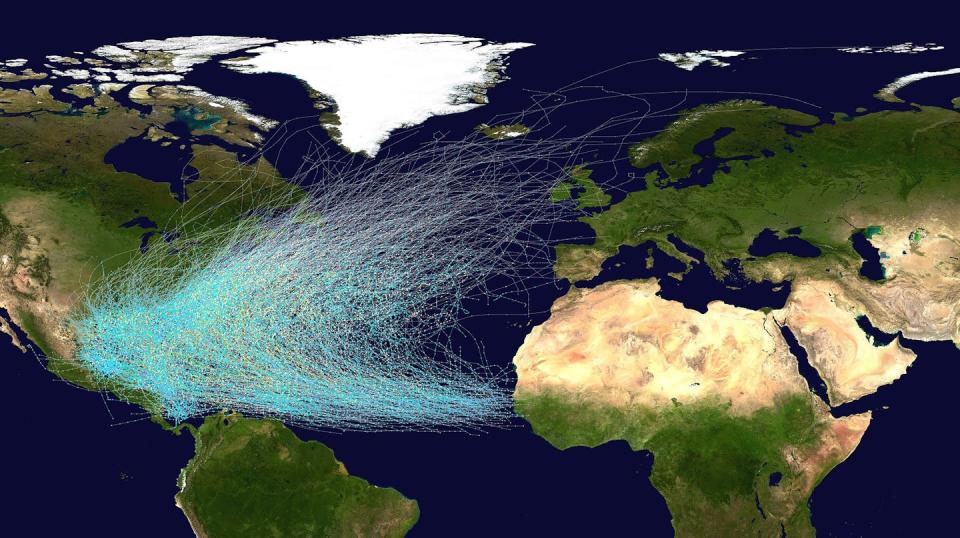
A significant percentage of North Atlantic storms pass over or near these islands, so these records appear to reflect changes in overall hurricane frequency in the North Atlantic over time.
By combining coastal sediment records from the Bahamas with records from regions further north, we can explore how changes in ocean surface temperatures, ocean currents, global-scale wind patterns, and atmospheric pressure variations affect regional hurricane frequency.
As sea surface temperatures rise, warmer water provides more energy that can fuel more powerful and destructive hurricanes. However, the frequency of hurricanes — how often they form — is not affected in the same way.

Secrets hidden in blue holes
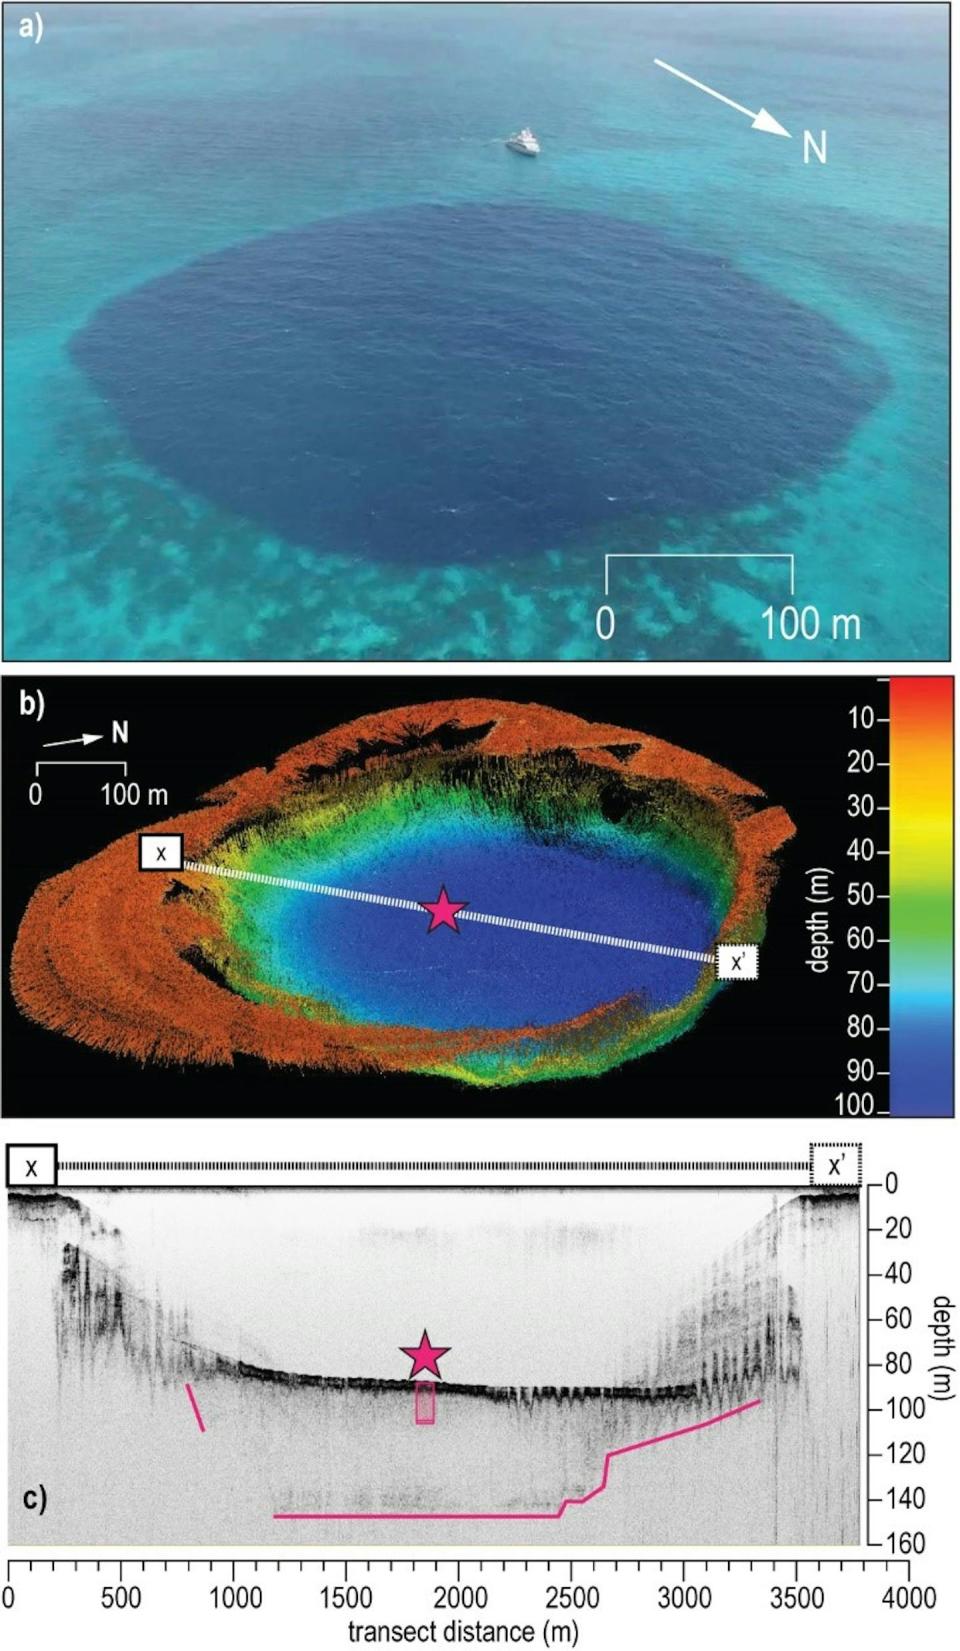
Some of the best places to study past hurricane activity are large depressions near the coast known as blue holes.
Blue holes get their name from their deep blue color. They were formed when carbonate rocks dissolved to form underwater caves. Eventually, the ceilings collapsed, leaving sinkholes. There are thousands of blue holes in the Bahamas, some a third of a mile wide and as deep as a 60-story building.
These tend to have deep vertical walls that can trap sediment (including sand carried by powerful hurricanes). Fortunately, there is usually very little oxygen at the bottom of deep blue holes, which slows down decay and helps preserve organic matter in the sediment over time.
breaking the sediment core
When we unearth a sediment core, layers of coarse sand are usually visible to the naked eye, but closer inspection can tell us much more about these past hurricanes.
I use X-rays to measure changes in sediment density, X-ray fluorescence to examine underlying changes that can reveal whether the sediment came from land or sea, and sediment texture analysis, which examines grain size.
We usually use radiocarbon dating to determine the age of each layer. By measuring the amount of carbon-14, a radioactive isotope, in shells or other organic material at various points in the core, I can create a statistical model that estimates the age of the sediments in the core.
So far, my colleagues and I have published five paleotornado records containing nearly yearly details from blue holes on islands in the Bahamas.
Each record shows periods of significant increases in storm frequency lasting decades and sometimes centuries.
Records vary and indicate that a single location may not reflect broader regional trends.
For example, Thatchpoint Blue Hole on Great Abaco Island in the northern Bahamas contains evidence of at least 13 Category 2 or higher hurricanes per century between 1500 and 1670. This significantly exceeds the rate of nine per century documented since 1850. During the same period, between 1500 and 1670, blue holes on Andros Island, just 300 kilometers south of Abaco, documented the lowest levels of local hurricane activity observed in this region during the past 1,500 years.
Spotting patterns in the Atlantic Basin
But together, these records offer a glimpse into broad regional patterns, and they also give us new insight into how changes in the ocean and atmosphere can affect hurricane frequency.
While rising sea surface temperatures provide more energy to fuel more powerful and destructive hurricanes, their frequency (how often they occur) may not be affected in the same way. Some studies predict that the total number of hurricanes will actually decrease in the future.
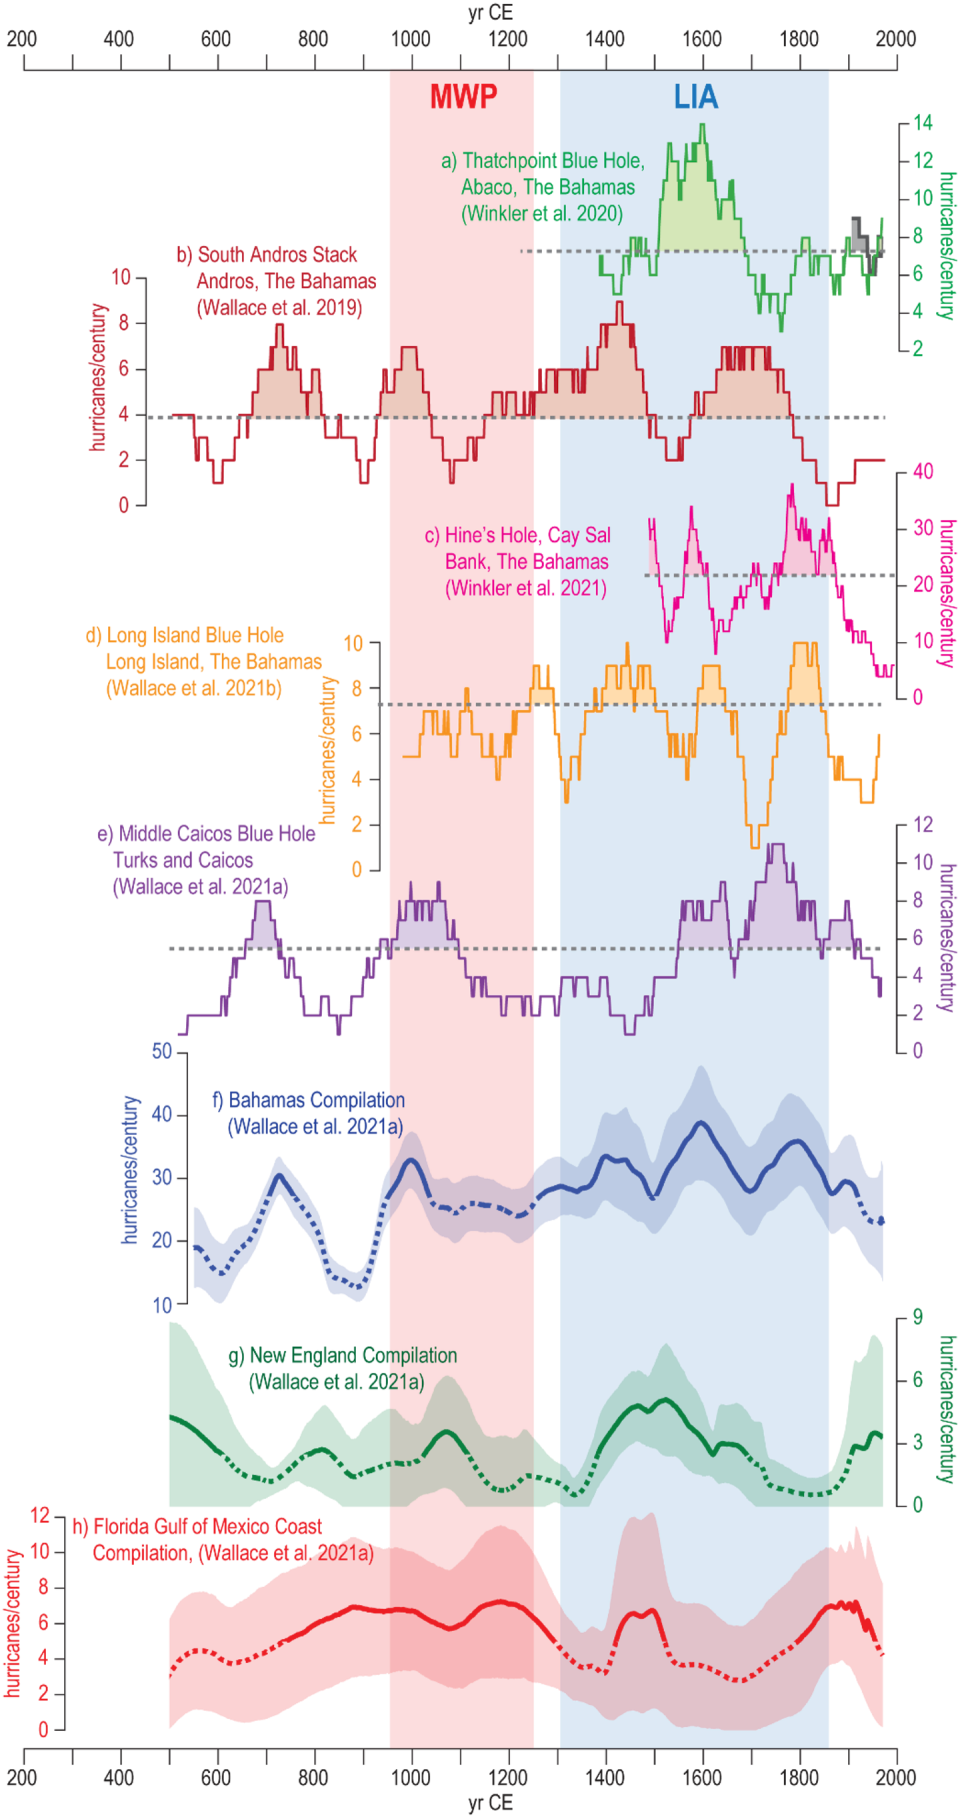
Compiled Bahamian records document a much higher frequency of hurricanes in the Northern Caribbean during the Little Ice Age, between 1300 and 1850, than during the previous 100 years.
At that time, North Atlantic surface ocean temperatures were generally cooler than they are today, but it also coincided with the intensifying West African monsoon. The monsoon may have produced more thunderstorms along the west coast of Africa, and these storms may have acted as low-pressure seeds for hurricanes.
Steering winds and vertical wind shear likely affect a region’s hurricane frequency over time. The Little Ice Age active interval observed in most Bahamian records coincides with increased hurricane strikes along the U.S. East Coast from 1500 to 1670, but was also a calmer period in the Gulf of Mexico, the Central Bahamas, and the southern Caribbean.
Records from places further north give us more information about the climate. This is because changes in ocean temperature and climate conditions are likely much more important for controlling regional effects in regions such as the Northeastern United States and Atlantic Canada, where cooler climate conditions are generally unfavorable for storms.
Warning for the islands
I am currently developing records of coastal storms in places like Newfoundland and Mexico that will help us better predict the impacts of future climate change on storm activity and coastal flooding.
Meanwhile, in the Bahamas, sea level rise puts the islands at increasing risk, so even weaker hurricanes can cause damaging flooding. Because storms are expected to become more intense, any increase in storm frequency could have devastating effects.
This article is republished from The Conversation, a nonprofit, independent news organization that delivers facts and trusted analysis to help you understand our complex world. By Tyler Winkler Woods Hole Oceanographic Institution
Read more:
Tyler Winkler does not work for, consult, own shares in, or receive funding from any company or organization that would benefit from this article, and has disclosed no relevant affiliations beyond his academic appointment.